
June 2023
IT Department Solipsism
When an IT organisation takes its own metrics, roadmap and architecture for the centre of the business, and how to turn the lens back outward
Abstract
Solipsism is the belief that only one’s own mind is sure to exist, and that the world beyond it is an inference. This paper argues that an IT department can fall into an organisational version of it: an inward-facing state in which the department treats its own systems, metrics, roadmap and target architecture as the centre of the enterprise, and the people who use its systems as an inference drawn from tickets. We at Nashua name four manifestations, transposed from a wider corporate pattern. The centrality illusion is the belief that the business thinks about IT as much as IT thinks about itself, when a user touches a system for a brief, instrumental moment inside a day that is about something else. The internal echo chamber is the governance in which an idea survives architecture boards and steering committees because it pleases the department, then meets the work and fails. The abstraction disconnect is the leadership attention paid to the platform, the single source of truth and the target architecture while the ground-level labour and the workarounds that actually keep the enterprise running go unseen. The inward lens is the habit of measuring success by uptime, tickets closed and milestones met, which describe the department’s own world rather than whether anyone got their work done. We give a minimal model that separates the value the business realises from the work the department counts, show how failure demand lets the measured numbers improve while the realised value falls, and derive early-warning indicators and their outward-facing replacements. We read the Dutch situation, where the demand-supply split of the regieorganisatie and a decade of public-sector ICT reviews make the pattern unusually visible, and trace a constructed case of a department that is green on every dashboard while the business it serves is not. This is practitioner-facing analysis; the paper closes with how the gap could be measured and tested.
Keywords: IT management; IT–business alignment; user-centred design; service-dominant logic; failure demand; shadow IT; inside view; metrics; enterprise architecture; organisational solipsism; Netherlands; regieorganisatie
1. Introduction
Ask an IT department how it is doing and it will answer in its own language: availability at three nines, the service desk inside its targets, the migration on plan, the audit passed, the roadmap on track. Ask the people the department exists to serve how IT is doing and the answer is in a different language entirely: the thing they needed took a week, the new portal has one more step than the old one, the report they live by is a spreadsheet they keep outside the system, and the fastest way to get anything done is to know someone. Both answers can be true at once, and when they are, the department has a condition this paper names and anatomises: it has turned inward, and taken its own world for the world.
We borrow the word solipsism on purpose. In philosophy it is the position that only one’s own mind is certain to exist and everything else is an inference that could be mistaken. An organisation cannot literally hold that belief, but it can behave as though it did. An IT department behaves solipsistically when its own artefacts, the systems it runs, the metrics it keeps, the roadmap it defends, the architecture it is building toward, become the things it treats as real, and the users, the work and the outcomes become an inference it draws from its own instruments, mostly from tickets. The inference is lossy, and the department does not notice the loss, because the instruments keep reading green. This is not stupidity and it is rarely bad faith. It is the natural drift of any group that is measured on its own activity, insulated from the people it serves by a layer of tickets and account managers, and rewarded by a hierarchy that sees the same inward numbers it does.
The pattern is not special to IT. It is a recognised failure of organisations in general, sometimes called corporate solipsism: a company that acts as if its brand, its metrics and its internal goals are the centre of its customers’ lives, out of touch with the people and the realities outside its walls. The marketing campaign that delights the board and dies in the market, the reorganisation that optimises the org chart and not the work, the obsession with high-level control over an abstraction while the ground-level labour that keeps the business running is ignored, are all the same inward turn. This paper transposes that pattern to the IT department, where it has its own characteristic shapes, its own instruments of self-deception, and, we will argue, its own cure.
The contribution is a vocabulary and a small model, not a new theory. The vocabulary is four manifestations (Section 3), each the IT form of a corporate original. The model (Section 4) separates the value the business realises from the work the department counts, and shows the mechanism, failure demand, by which the two can move in opposite directions, so that the department looks healthiest on the dashboards exactly where it is serving worst. From the model we read a set of early-warning indicators and their outward-facing replacements (Section 5). The question the paper asks is therefore: how does an IT department come to mistake its own instruments for the business it serves, how can it tell, and how does it turn the lens back outward?
The paper is written for the Dutch situation, which shows the pattern with unusual clarity (Section 6). The organising idea of Dutch IT governance over the last fifteen years, the regieorganisatie that separates a demand organisation from a supplying one, institutionalises exactly the distance between the department and the work that feeds the inward turn; and a decade of public reviews, from the parliamentary ICT inquiry to the standing review body that followed it, is in large part a record of public IT projects that served their own logic rather than the citizen’s. Section 7 traces a constructed case. Sections 8 to 11 give the cure, answer objections, state limits and conclude.
2. Background and related work
2.1 Solipsism as an organisational metaphor
That organisations lose contact with their outside is an old observation under many names. Janis (1972) described groupthink, the tendency of a cohesive group to converge on a view that preserves its own harmony at the expense of reality testing. Beer (1979) built an entire cybernetics of management on the principle that an organisation is viable only if its internal model of the world is corrected by channels that carry the outside in, and failing when those channels atrophy; his dictum that the purpose of a system is what it does, not what it says it does, is the diagnostic this paper applies to dashboards. Weick (1995) showed how organisations enact the environment they then take as given, so that an inward-facing unit does not merely misread its world but partly manufactures the readings. None of these authors wrote about IT departments, but each described the mechanism by which a group comes to live inside its own account of things.
2.2 The inside view and the outside view
The most exact description of the cognitive error belongs to Kahneman and Lovallo. The inside view forecasts a project from the details of the project itself, the plan, the team, the Gantt chart; the outside view forecasts it from the record of similar projects, most of which ran late (Lovallo & Kahneman, 2003). The inside view feels more rigorous because it is built from what the planner can see, and it is reliably wrong, because what the planner can see is the department’s own machinery and not the base rate of the world. An IT department that plans, measures and reports from the inside view is solipsistic in precisely the technical sense: it reasons from its own contents and treats the outside as an inference. The cure the authors propose, anchoring on the outside record, is the cure this paper proposes for metrics.
2.3 Value as the user experiences it
A parallel literature insists that value is not created by a provider and shipped, but realised by a user in use. Service-dominant logic (Vargo & Lusch, 2004) makes the point generally: the provider can only offer a value proposition, and value is co-created and determined by the beneficiary in their own context. The jobs-to-be-done tradition makes it operational: people do not want a product, they hire it to make progress on a job that arises in their lives, and the unit of analysis is the job, not the product (Christensen et al., 2016; Ulwick, 2005). Von Hippel (1986) showed that the users at the leading edge of a need are often a better source of what to build than the provider’s own planning. Norman’s (2013) design tradition says the same from the side of use: a system should be shaped around the user’s goals and the structure of their task, and a system shaped around the provider’s model of itself is the standard way to produce something unusable. Read together, these say that an IT department’s output is not systems but the work those systems let people do, and that the department cannot see that output from the inside.
2.4 The gap between the plan and the work
Finally, a tradition in information systems has documented, repeatedly, that the formal system and the actual work diverge, and that the divergence is where value lives or dies. Suchman (1987) showed that human action is situated, improvised against the particulars of the moment, and only loosely governed by the plans that are supposed to direct it, so that a system built from the plan misfits the work. Ciborra (2002) described how real information systems drift from their designers’ intentions as people make them work through bricolage and workaround, and argued that the workaround is data about the misfit, not disobedience. Markus (1983) and Keen (1981) showed that user resistance to a system is usually a rational response to how the system redistributes effort and power, and therefore a signal to be read rather than an obstacle to be overcome. Orlikowski (2000) reframed technology as something constituted in use rather than embodied in the artefact. The common finding is that the ground truth of an IT system is in the hands of the people using it, which is exactly the place a solipsistic department does not look. The shadow systems that result, the spreadsheets and the unsanctioned tools, have become their own field of study (Haag & Eckhardt, 2017); we read them in Section 3 as the clearest message the business sends about the misfit, and the one most often misheard.
3. Four manifestations
We name four shapes the inward turn takes in an IT department. They overlap and reinforce one another, but each has a distinct tell, and naming them separately lets a department find which it has. Table 1 sets each beside its corporate original and its ground-level sign.
3.1 The centrality illusion
The first manifestation is the belief that the business thinks about IT roughly as much as IT thinks about itself. The department has a brand in its own eyes: a name, a portal, a service catalogue, a set of values on a wall, a roadmap it is proud of. It imagines the user arriving at the portal with attention and intent, reading the announcement, appreciating the new feature, caring which release it is. The user does none of this. The user is in the middle of a day that is about closing a sale, treating a patient, booking a shipment or teaching a class, and the system is a thing they must pass through to get on with it, ideally without noticing. Their interaction with IT is brief, instrumental and grudging, one of dozens of tools competing for a sliver of their attention, and the feeling they bring to it is at best neutral and at worst the irritation of an interruption.
The illusion is costly because it sets the wrong goal. A department that believes it occupies space in the user’s mind builds for engagement: portals with news, dashboards for everyone, features that invite exploration, notifications that announce themselves. A department that understands it occupies a grudging instant builds for disappearance: the fewest steps, the strongest defaults, the system that does the obvious thing without being asked and then gets out of the way. The two build opposite things, and only the second serves a user whose attention is elsewhere. The centrality illusion is why so many internal tools are designed as destinations when they should be designed as doorways.
3.2 The internal echo chamber
The second manifestation is governance that selects for what pleases the department rather than what serves the work. An idea, a new platform, a standard, a self-service portal, a reorganisation of support, is born inside IT and must survive a gauntlet of internal bodies: an architecture board, a change advisory board, a steering committee, a CIO’s staff meeting. Each body judges the idea against internal criteria, elegance, standardisation, vendor strategy, cost allocation, control, and an idea that flatters those criteria passes, gathering sponsors as it climbs. By the time it reaches the business it has been refined for months against the preferences of people who will never use it, and it meets the work for the first time at launch, where it fails, not because the engineering was poor but because no outside channel was ever on its path. The portal nobody asked for, the self-service tool that generates more calls than it deflects, the migration that solved an IT problem and created a business one, are all products of a review process with no window to the outside.
The echo chamber is the IT form of the tone-deaf campaign that delights the boardroom and dies in the market. Its signature is that failure is surprising. A department whose ideas are tested against the work expects some to fail and learns cheaply; a department whose ideas are tested against itself is repeatedly astonished, because everyone it consulted agreed. The remedy is not better boards but a different gate: an idea should meet a real user doing real work before it accumulates internal sponsors, not after, so that the outside can kill it while killing it is still cheap.
3.3 The abstraction disconnect
The third manifestation is the attention leadership pays to high-level control and abstraction over the ground-level labour that keeps the enterprise running. The senior conversation is about the target architecture, the single source of truth, the platform, the cloud posture, the data strategy, the single pane of glass, abstractions that are attractive precisely because they promise control from above without contact with the mess below. Meanwhile the enterprise actually runs on a substrate the abstraction does not model: the overnight batch that one person understands, the reconciliation someone does by hand every month, the integration held together by a scheduled export, the tribal knowledge of which system to trust when two disagree. This labour is invisible from the top because it does not appear in the architecture diagram, and a department in the grip of the abstraction treats the diagram as the territory.
The disconnect is dangerous at exactly the moments the abstraction is meant to help. A consolidation onto the single platform, planned from the diagram, discovers too late that the decommissioned system was load-bearing in a way no diagram showed, because its real role lived in a workaround. The map omitted the bridge the traffic actually used. Enterprise architecture as a discipline is not the problem; the problem is architecture practised as an inward act, drawing the system the department wishes it ran rather than discovering the system it does run. The cure is ethnographic before it is architectural: go and watch the work, find the hand reconciliations and the load-bearing spreadsheets, and treat them as the specification of what the platform must not break.
3.4 The inward lens
The fourth manifestation underlies the other three: the habit of looking at everything through metrics that describe the department’s own operation rather than the user’s outcome. Availability, mean time to resolve, tickets closed, change success rate, project milestones hit, budget adherence, audit findings closed, these are the instruments on the wall, and every one of them measures something happening inside IT. None of them measures whether a person was able to do their work, how long their task actually took end to end, how much of their effort went to fighting the tools, or whether the thing they needed exists at all. The lens points inward, and what it cannot see it cannot manage.
The inward lens is not merely incomplete; it is actively misleading, because the inward metrics can be optimised in ways that harm the outward outcome. A service desk measured on tickets closed and time-to-close learns to close tickets, which is not the same as solving problems; a fast, superficial closure that does not fix the underlying issue produces a second ticket, and the department that counts both as throughput sees productivity where the user sees a problem that took two calls. This is the mechanism the next section models, and it is the reason a department can be green on every dashboard while the business it serves is not. User-centred design is, at bottom, the instruction to turn this lens around: to start from the user’s goal and look back at IT, rather than starting from IT’s operation and inferring the user.
Table 1. The four manifestations of IT department solipsism: the corporate pattern each transposes, the form it takes in an IT department, and the ground-level sign that it is present.
| Manifestation | Corporate original | Form in the IT department | The tell |
|---|---|---|---|
| Centrality illusion | The brand imagined as a large part of the customer’s life | The portal, catalogue and roadmap imagined as objects of the user’s attention | Tools built as destinations to visit, not doorways to pass through |
| Internal echo chamber | Campaigns that please the board and fail in the market | Ideas that survive architecture and steering boards, then meet the work and fail | Failure at launch is surprising; everyone consulted had agreed |
| Abstraction disconnect | Obsession with high-level control and IP over ground-level labour | Attention on target architecture and platforms while hand workarounds run the enterprise | A decommissioning breaks something no diagram showed |
| Inward lens | Judging success by internal operational metrics | Uptime, tickets closed and milestones measured; task completion not | Dashboards green while users route around the systems |
4. A minimal model: the solipsism gap
The four manifestations share a measurable consequence: a gap between what the department counts and what the business realises. This section gives a small model of that gap, enough to show why the two can diverge and why the divergence is self-reinforcing. The model is a sketch meant to make the mechanism explicit, not a calibration.
4.1 Two kinds of demand
Follow the service-management tradition in splitting the work that arrives at an IT department into two kinds (Seddon, 2008). Value demand is work the business genuinely wants done: a new capability, a real change, a question that needs answering. Failure demand is work created by the department’s own prior failure to do something, or to do it right: the user who calls back because the first fix did not hold, the request for a workaround to a system that should not have needed one, the reopened ticket, the second visit. Let total demand in a period be
Equation 1. Demand on the department splits into value demand and failure demand.
and define the solipsism ratio as the share of the department’s work that is about its own prior failures,
Equation 2. The solipsism ratio: how much of the department’s activity is a reaction to itself.
The ratio is well named. A department with a high spends most of its effort responding to the consequences of its own work, a literal turning-inward of activity, and yet every unit of that effort appears in the inward metrics as a ticket handled and a problem closed.
4.2 Why the numbers and the value diverge
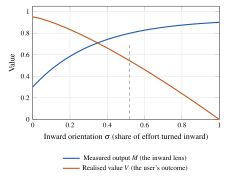
Let the department’s measured output, the quantity the inward lens reports, be the total work it processes, which to a first approximation is all of : every ticket closed, value or failure, counts. Let the realised value, the quantity the business experiences, be the value demand actually met, net of the friction the failures impose, so that it falls as rises. Writing for measured output and for realised value as functions of the department’s throughput and the ratio ,
Equation 3. Measured output counts all work; realised value counts only value demand met, scaled by fit .
where is how well the delivered work fits the user’s actual job, the quantity the manifestations of Section 3 degrade. The gap between what is counted and what is realised,
Equation 4. The solipsism gap widens with throughput, with failure demand and with poor fit.
grows with throughput, with the failure ratio and with misfit. The department can raise by raising , working harder, closing faster, while stays flat or falls, and the dashboards will show the effort as progress. Figure 1 draws the two quantities as the inward orientation increases: measured performance rises while realised value declines, a pair of blades that cross at the point where the department looks healthiest exactly as it begins to serve worst.
4.3 Why it reinforces itself
The gap would be merely a measurement problem if were fixed. It is not, because optimising the inward metric feeds it. Pressure to close tickets faster lowers the fit of each closure and raises the chance that the underlying problem returns as failure demand, so next period’s is higher. Let the inward optimisation effort be , the attention the department pays to its own metrics, and let outward listening, the attention it pays to the work, be . A simple adjustment captures the loop:
Equation 5. Inward optimisation raises the failure ratio; outward listening lowers it.
with . When inward pressure dominates () the ratio climbs to a high fixed point: a stable, self-sustaining state in which the department is permanently busy with itself, permanently green on its instruments, and permanently adrift from the work. That fixed point is organisational solipsism as a steady state, and the only parameter that moves the department off it is , the attention it pays to the outside. Every manifestation in Section 3 is a way of holding near zero.
5. Early-warning indicators
The model says a department cannot tell it is turning inward from its inward metrics, by construction. It can tell from a second set of indicators, each pairing an inward signal that looks healthy with the outward reality it hides and the outward measure that would reveal it. Table 2 collects them. The indicators are diagnostic, not merely rhetorical: each names a number the department could start collecting tomorrow, and the act of collecting it is itself the first turn of the lens.
Three of them deserve a word. The first is failure demand as a share of volume: most departments measure ticket volume and celebrate when they handle it, but do not split it, and the split is the single most revealing number a service desk can keep, because a rising share means the department is increasingly busy with itself. The second is the shadow-IT census: a solipsistic department treats the spreadsheet maintained outside the sanctioned system as a compliance problem to be stamped out, when it is a precise message about where the sanctioned system misfits the work; counting the shadow systems and reading them as specifications turns a threat into the best free research the department will ever get. The third is time-to-task, not time-to-ticket: the department measures how fast it closes its own records, but the user measures how long the whole job took, including the parts before a ticket was raised and after it was closed, and only the end-to-end time is the thing the user actually feels.
Table 2. Early-warning indicators of IT department solipsism. Each inward signal can look healthy while the outward reality it conceals goes unmeasured; the final column is the outward-facing number that reveals it.
| Inward signal (looks healthy) | Outward reality it can hide | What to measure instead |
|---|---|---|
| Tickets closed within target | Many closures are superficial and return as new tickets | Failure demand as a share of total volume, tracked over time |
| High availability of each system | The end-to-end task still takes days across systems and hand-offs | Time-to-task: elapsed time for the user’s whole job, not per ticket |
| Roadmap on plan; features shipped | Features nobody adopted; usage concentrated in a few old screens | Adoption and task-completion rates per feature, with the unused retired |
| Portal and self-service launched | Calls did not fall, or rose, because the portal added a step | Deflection actually realised, and steps-to-outcome before vs after |
| Shadow IT being eliminated | The spreadsheets encode real needs the systems do not meet | A shadow-IT census read as a specification of unmet needs |
| Satisfaction survey score high | The survey asks about IT, not about whether the work got done | Outcome questions: could you do your task, how long, what fought you |
6. The Dutch situation
The pattern is general, but the Dutch context gives it an unusually clear form, for two institutional reasons and one market one.
6.1 The regieorganisatie and the distance it builds
The dominant idea in Dutch IT governance over the last fifteen years has been the regieorganisatie: a deliberate separation of a demand organisation, which owns the relationship with the business and decides what is wanted, from a supply organisation, often an external provider, which builds and runs it. The split has real virtues, and we are not against it. But it institutionalises the exact distance that feeds the inward turn. The demand side comes to measure itself on the management of suppliers, contracts met, service levels reported, governance meetings held, and the supply side on the delivery of services as specified, both of them inward activities, while the user’s actual work sits beyond both, reached only through the paperwork that passes between them. A regieorganisatie that is not deliberately wired to the work measures the relationship between two IT organisations and calls it performance. The cure in Section 8 applies with particular force here: the demand organisation’s real job is to carry the outside in, and if it measures itself on supplier governance it has quietly become the thing it was meant to prevent.
6.2 A decade of public reviews
The Dutch state has kept an unusually public record of inward-facing IT. The parliamentary inquiry into government ICT projects (Tweede Kamer, 2014) found a pattern of large projects driven by their own momentum and internal logic, insufficiently anchored to the problem they were meant to solve or to the people who would use the result, and recommended a standing body to test projects against reality before and during build. That body, now the Adviescollege ICT-toetsing, exists precisely because the inside view is not self-correcting: an expert outside channel has to be built and funded, because departments left to their own instruments do not acquire one. The lesson generalises beyond government. The reason the cure in this paper is institutional, a gate, a census, a measure, rather than an exhortation to care about users, is that caring is not the scarce input; the scarce input is a channel that carries the outside in whether the department wants it or not.
6.3 The managed-services relationship
In the Dutch mid-market, where we at Nashua work, most organisations do not run a large internal IT department at all; they rely on a managed-services provider. This changes the shape of the risk but not its nature. A provider is measured on its service levels and its contract, which are inward metrics of the provider’s world, and a provider that manages to those alone can report a healthy relationship while its client’s staff route around the systems. The outward discipline a good provider owes its client is the same one an internal department owes its business: to measure the client’s task completion and not only the provider’s uptime, to read the client’s workarounds as specifications, and to count the share of its own work that is failure demand. A provider that does this turns the distance of the relationship from a liability into an advantage, because it sees many clients’ work and can carry the outside view between them. A provider that does not becomes a solipsistic IT department at one remove, with a contract in place of a conscience.
7. A constructed case
The following case is constructed, not observed. It exists to show the manifestations and the model in one setting; its figures are illustrative. It describes a mid-sized Dutch organisation with an internal IT department of about forty people serving roughly a thousand staff across operations, sales and finance.
On its own instruments the department has its best year. Availability across the core systems is 99.9 per cent. The service desk closes eighty-five per cent of tickets within target, and total volume is up twelve per cent, which the quarterly report presents as rising productivity. The multi-year platform consolidation is on plan: three legacy systems retired, everything moving to the single suite. The annual IT-satisfaction survey returns a respectable score. Every slide is green, and the department’s leadership, reading its instruments faithfully, believes it is doing well.
Beneath each green number is an ungreen reality the instruments do not carry. The twelve per cent rise in ticket volume is mostly failure demand: the new release of the suite changed a screen the sales team used fifty times a day, and the resulting confusion generates a steady stream of tickets, each closed quickly and well by the desk’s own lights, none of them touching the cause. Availability is measured per system, but the order-to-cash task now crosses three systems and two hand-offs, and the elapsed time for the task has grown from hours to two days, a number no dashboard shows because no dashboard measures the task. The consolidation retired a legacy reporting tool whose real role, undocumented, was a nightly export that the finance team’s month-end reconciliation depended on; finance has rebuilt it as a spreadsheet maintained by one analyst, which the department, when it notices, logs as shadow IT to be eliminated. The satisfaction survey scored well because it asked whether the service desk was polite and whether systems were available, and not whether anyone could do their work.
The department is, by the definition of this paper, solipsistic, and the striking thing is that no one in it is doing a bad job. The desk is genuinely fast and courteous. The engineers genuinely delivered the consolidation. The architecture is genuinely cleaner. Every person is optimising the metric in front of them, and every metric points inward, so the sum of competent, well-meant work is a department that has turned its back on the business while believing it faces it. The model of Section 4 names the state precisely: throughput is up, the ratio is rising, measured output rises with throughput while realised value falls with , and the two instruments the department lacks, failure demand as a share of volume and time-to-task, are exactly the two that would have shown it.
8. Turning the lens outward
The cure is not to care more. The people in the constructed case already care, and caring routed through inward instruments produces inward work. The cure is to build channels that carry the outside in whether or not anyone remembers to look, and to change what is measured so that the department’s own optimisation pulls it toward the work rather than away. Five moves follow from the model and the manifestations.
Measure the task, not the ticket. Add at least one outcome measure to every inward one: time-to-task beside time-to-resolve, task completion beside availability, adoption beside features shipped. The point is not to discard the inward metrics, which are useful for running the operation, but to deny them the monopoly on attention that lets the gap of Section 4 open unseen.
Split and watch failure demand. Classify incoming work as value demand or failure demand and track the ratio over time. It is the cheapest diagnostic in this paper and the most direct read on the inward turn, because it measures how much of the department’s effort is a reaction to itself.
Read shadow IT as specification. Keep a census of the spreadsheets and unsanctioned tools, and treat each as a precise statement of where the sanctioned systems misfit the work. The workaround is the business writing requirements in the only language it has left; a department that stamps it out is destroying its own best research.
Put a user on the path before the sponsors. Change the governance gate so that an idea meets a real user doing real work early, while killing it is cheap, rather than after it has climbed the internal hierarchy and accumulated sponsors. This is the structural fix for the echo chamber: it inserts an outside channel upstream of the internal ones.
Go and watch the work. Before any consolidation or decommissioning, send someone to observe the ground-level labour the abstraction does not model, and to find the hand reconciliations and load-bearing spreadsheets. Treat what they find as the specification of what the new platform must not break. This is the structural fix for the abstraction disconnect, and it is ethnographic before it is architectural.
None of these is expensive, and that is the point. Organisational solipsism is not cured by a budget or a reorganisation; it is cured by a handful of outside channels deliberately built and kept open, because the natural tendency of an insulated, inwardly measured group is to close them.
9. Objections and replies
The inward metrics matter; you cannot run an operation without them. Agreed, and the paper does not say otherwise. Availability and resolution time are necessary to run the service. The claim is narrower and sharper: they are not sufficient, they describe the department’s world and not the user’s, and when they are the only instruments on the wall they let the gap open unseen. The remedy is addition, not replacement.
Users do not know what they want, so user-centredness is a path to chaos. The jobs-to-be-done tradition answers this precisely: users are poor at specifying solutions and excellent at exhibiting their jobs. The instruction is not to ask users to design the system but to observe the work, read the workarounds and measure the outcome, none of which requires the user to know the answer, only to be watched doing the task.
This is just user-centred design with a new label. In part, deliberately. The contribution is not a new method but a diagnosis of why a department equipped with the methods still turns inward, namely that its measurement and its governance both point inward and reinforce each other, and a small model of how that produces a gap that is invisible from inside. The label names the failure mode so that a department can recognise it in itself.
A managed-services provider is structurally outside the business; this does not apply. It applies with more force, not less. Distance is the condition that feeds the inward turn, and a provider measured on its contract is as capable of solipsism as any internal department, as Section 6 argues. The provider’s advantage is that it sees many clients and can carry the outside view between them, but only if it chooses to measure the client’s work rather than its own service levels.
10. Limitations and research agenda
This is practitioner-facing analysis, and its limits should be stated. The model of Section 4 is a sketch: its quantities are defined clearly enough to measure but its functional forms are illustrative, chosen to make the mechanism visible rather than estimated from data. The four manifestations are a typology, useful if it helps a department find its failure mode, but not a partition proved to be exhaustive. The Dutch reading is interpretive. The constructed case is constructed.
The claims are nonetheless testable, and the outward indicators are the instruments to test them with. Four studies would do it. First, measure the solipsism ratio across a set of departments and correlate it with an independent measure of business-realised value; the model predicts a negative relation that the inward metrics do not show. Second, track and the inward metrics through a period of pressure on the inward metrics; the model predicts rises as the inward numbers improve. Third, instrument time-to-task alongside time-to-resolve across a real service and measure the gap between them. Fourth, run the governance change, a user on the path before the sponsors, as a controlled intervention and measure the launch-failure rate against the current gate. Each study needs only measures the paper already names, and each would move the argument from analysis to evidence.
11. Conclusion
An IT department turns inward not through incompetence or indifference but through the ordinary operation of being measured on its own activity, insulated from the work by a layer of tickets and contracts, and rewarded by a hierarchy that reads the same inward instruments it does. The result is a department that takes its own systems, metrics, roadmap and architecture for the centre of the enterprise and the users for an inference it draws from tickets, an organisational version of the belief that only one’s own mind is sure to exist. We have named four manifestations, the centrality illusion, the internal echo chamber, the abstraction disconnect and the inward lens, and shown with a small model how failure demand lets the department’s measured output rise while the value the business realises falls, so that the dashboards look healthiest exactly where the service is worst.
The cure is not exhortation but plumbing: a handful of outside channels deliberately built and kept open, because the natural tendency of an insulated, inwardly measured group is to let them close. Measure the task and not only the ticket. Split and watch failure demand. Read shadow IT as a specification. Put a user on the path before the sponsors. Go and watch the work. Each is cheap, each carries a piece of the outside in, and together they turn the lens back around, so that a department measures itself by whether the business it serves can do its work, which is the only measure that was ever real.
Appendix A. Measuring the solipsism gap
The gap of Section 4 can be approximated from data most service operations already hold, plus two measures they usually do not. All can be collected quarterly without a survey.
Failure-demand share . For a representative sample of closed items, classify each as value demand (a genuine new need) or failure demand (work caused by a prior failure to do or to do right), by a short coding rule applied at closure or on a retrospective sample. The share of failure demand is . Pitfall: coding at closure by the same agent who closed the item understates it; use an independent sample.
Fit . Approximate fit by the complement of the reopen-and-rework rate: the fraction of value-demand items that are completed without a subsequent related item within a defined window. Pitfall: a short window flatters ; set it to the user’s own cycle, not the desk’s.
Time-to-task. For a small set of representative user journeys, measure elapsed time for the whole journey, from the moment the user needs the outcome to the moment they have it, across every system and hand-off, independent of ticket boundaries. Pitfall: measuring from first ticket to last closure misses the parts of the task that never became a ticket, which are often the longest.
The gap. With the total items processed and , the solipsism gap is . Reported as a ratio , it is comparable across departments and over time, and it rises when either failure demand or misfit rises, which are the two things the inward metrics hide.
Appendix B. A diagnostic checklist
The questions below are grouped by manifestation. A yes is a symptom, not a verdict; several yes answers in one group locate the failure mode, and the outward test in the last column is the measurement that would confirm or dismiss it. The checklist is deliberately answerable in an afternoon, because a diagnosis that needs a project will not be run.
Table 3. A diagnostic checklist, by manifestation. Each symptom is a question the department can answer about itself; the outward test is the measurement that settles it.
| Manifestation | Symptom (a yes is a sign) | Outward test |
|---|---|---|
| Centrality illusion | Are internal tools built as destinations with news and dashboards? | Measured steps-to-outcome and bounce from the portal |
| Internal echo chamber | Do ideas reach a user only at launch, after the boards? | Launch-failure rate vs a gate with a user upstream |
| Abstraction disconnect | Does a decommissioning ever break something no diagram showed? | Count of load-bearing workarounds found by observation |
| Inward lens | Are all the dashboard metrics about IT’s own operation? | Share of metrics that measure a user outcome |
References
Beer, S. (1979). The heart of enterprise. John Wiley & Sons. ISBN 978-0-471-27599-1.
Brynjolfsson, E. (1993). The productivity paradox of information technology. Communications of the ACM, 36(12), 66–77. https://doi.org/10.1145/163298.163309
Christensen, C. M., Hall, T., Dillon, K., & Duncan, D. S. (2016). Know your customers’ “jobs to be done.” Harvard Business Review, 94(9), 54–62. https://hbr.org/2016/09/know-your-customers-jobs-to-be-done
Ciborra, C. (2002). The labyrinths of information: Challenging the wisdom of systems. Oxford University Press. ISBN 978-0-19-924152-7.
Davis, F. D. (1989). Perceived usefulness, perceived ease of use, and user acceptance of information technology. MIS Quarterly, 13(3), 319–340. https://doi.org/10.2307/249008
DeLone, W. H., & McLean, E. R. (2003). The DeLone and McLean model of information systems success: A ten-year update. Journal of Management Information Systems, 19(4), 9–30. https://doi.org/10.1080/07421222.2003.11045748
Haag, S., & Eckhardt, A. (2017). Shadow IT. Business & Information Systems Engineering, 59(6), 469–473. https://doi.org/10.1007/s12599-017-0497-x
Henderson, J. C., & Venkatraman, N. (1999). Strategic alignment: Leveraging information technology for transforming organizations. IBM Systems Journal, 38(2&3), 472–484. https://doi.org/10.1147/sj.382.0472
Janis, I. L. (1972). Victims of groupthink: A psychological study of foreign-policy decisions and fiascoes. Houghton Mifflin.
Keen, P. G. W. (1981). Information systems and organizational change. Communications of the ACM, 24(1), 24–33. https://doi.org/10.1145/358527.358543
Lovallo, D., & Kahneman, D. (2003). Delusions of success: How optimism undermines executives’ decisions. Harvard Business Review, 81(7), 56–63. https://hbr.org/2003/07/delusions-of-success-how-optimism-undermines-executives-decisions
Markus, M. L. (1983). Power, politics, and MIS implementation. Communications of the ACM, 26(6), 430–444. https://doi.org/10.1145/358141.358148
Norman, D. A. (2013). The design of everyday things (Revised and expanded ed.). Basic Books. ISBN 978-0-465-05065-9.
Orlikowski, W. J. (2000). Using technology and constituting structures: A practice lens for studying technology in organizations. Organization Science, 11(4), 404–428. https://doi.org/10.1287/orsc.11.4.404.14600
Seddon, J. (2008). Systems thinking in the public sector: The failure of the reform regime and a manifesto for a better way. Triarchy Press.
Suchman, L. A. (1987). Plans and situated actions: The problem of human–machine communication. Cambridge University Press. ISBN 978-0-521-33739-7.
Tweede Kamer der Staten-Generaal (2014). Naar grip op ICT: Parlementair onderzoek naar ICT-projecten bij de overheid. Eindrapport van de Tijdelijke commissie ICT-projecten bij de overheid (Commissie Elias). Kamerstukken II 2014/15, 33 326, nr. 5. https://zoek.officielebekendmakingen.nl/kst-33326-5.html
Ulwick, A. W. (2005). What customers want: Using outcome-driven innovation to create breakthrough products and services. McGraw-Hill. ISBN 978-0-07-140867-7.
Vargo, S. L., & Lusch, R. F. (2004). Evolving to a new dominant logic for marketing. Journal of Marketing, 68(1), 1–17. https://doi.org/10.1509/jmkg.68.1.1.24036
von Hippel, E. (1986). Lead users: A source of novel product concepts. Management Science, 32(7), 791–805. https://doi.org/10.1287/mnsc.32.7.791
Weick, K. E. (1995). Sensemaking in organizations. Sage Publications. ISBN 978-0-8039-7177-6.