
The Monoculture Premium
When standardising the IT landscape makes the enterprise more fragile, and how much to standardise instead
Abstract
Consolidating an enterprise’s systems onto fewer platforms is orthodox advice, and for good reason: fewer platforms cost less to run, staff and integrate. This paper argues that the advice is right only up to a point, and that the point can be calculated. Standardisation trades many small, independent failures for few large, correlated ones; when the harm of an outage grows faster than its size, as it does whenever functions can cover for one another, workarounds are finite, and regulatory or reputational thresholds exist, the expected loss from outages rises as platforms are consolidated, even though the probability of any one failure does not. We at Nashua write down a minimal model of an enterprise choosing how many platforms to run, with a run cost that falls with consolidation and an outage loss that is convex in the share of the enterprise taken down, and derive the number of platforms that minimises their sum in closed form. The result is non-monotonic: full standardisation is optimal when outages are rare, cheap or linear in their reach, and otherwise an interior number of platforms is, with the difference, the monoculture premium, being a cost that consolidation business cases do not currently carry. We show that nominal diversity overstates real diversity whenever platforms share a component, give an effective-diversity measure, and argue that tightly coupled process chains should be standardised while loosely coupled functions should not. The analysis is anchored in the Dutch situation: the July 2024 endpoint-security outage that reached airports, hospitals and ministries through one standardised component; the national digital identity as a single point of failure by design; and the European regulations, DORA and NIS2, that now make concentration risk a supervised quantity. A constructed bank consolidating four core platforms shows that the orthodox move to one can raise its total cost while a move to two lowers it. This is theoretical research and the paper closes with how it could be measured.
Keywords: standardisation; IT consolidation; concentration risk; correlated failure; monoculture; resilience; portfolio diversification; DORA; NIS2; Netherlands; operational risk
1. Introduction
By standardisation we mean the reduction of the number of distinct platforms, products, suppliers or components that an enterprise runs for a given purpose, so that more of the enterprise depends on each one that remains. It is among the least controversial recommendations in information technology. Fewer platforms mean fewer licences, fewer skills to maintain, fewer integrations to build and fewer things to secure; the enterprise-architecture literature treats a standardised core as a foundation for execution (Ross, Weill & Robertson, 2006), and consolidation programmes are a staple of every cost review. We at Nashua recommend standardisation often, and this paper does not argue that it is wrong. It argues that it is non-monotonic: good up to a point, harmful beyond it, and that the point can be computed from quantities an enterprise can estimate.
The argument was made for us on 19 July 2024, when a faulty content update to a widely deployed endpoint-security product disabled an estimated 8.5 million Windows computers within hours (Weston, 2024; CrowdStrike, 2024). The product had been chosen by thousands of organisations for the best of reasons: it was capable, it was standard, and running one security agent everywhere was simpler than running several. The outage reached airlines, airports, hospitals, broadcasters and ministries in the same morning, in the Netherlands as elsewhere, because they had all standardised on the same component. No single one of them had made a mistake. Together they had built a monoculture, and a monoculture fails all at once.
The ecological analogy is old (Geer et al., 2003) and has usually been made about software security: a population running one operating system is vulnerable to one exploit. This paper makes a different and broader claim. The harm from correlated failure does not depend on an attacker; it depends only on the shape of the loss function, on whether losing the whole enterprise at once is worse than losing its parts separately. We argue that it almost always is, show that this alone makes expected outage loss rise with consolidation, and derive how many platforms an enterprise should run as a function of its outage probability, its loss scale, the convexity of its loss, and the cost of each additional platform.
The paper asks: under what conditions does standardising the IT landscape increase rather than decrease the enterprise’s expected loss, and how much should an enterprise standardise instead? Section 2 places the question among the literatures that have answered it in other fields. Section 3 gives the model and the closed-form optimum. Section 5 argues where the convexity comes from and where it is absent. Section 7 shows why nominal diversity overstates real diversity. Section 9 reads the Dutch situation through the model. Section 10 traces a constructed bank. Sections 12 to 16 give rules, limits and conclusions.
The Dutch framing is deliberate. The Netherlands runs a national digital identity through which most citizens reach government, health insurers and pension funds, and it is a single point of failure by design. Its financial sector has, since January 2025, been subject to a European regulation that requires institutions to assess the concentration of their ICT dependencies and to report major incidents; its critical sectors are coming under the Dutch implementation of a second regulation that extends the duty. Concentration risk has become, in the Netherlands, a supervised quantity. This paper is an attempt to give it a price.
2. Background
2.1 The case for standardisation
The benefits of consolidation are real and well documented. Ross, Weill and Robertson (2006) showed that enterprises with a standardised, integrated core executed strategy more reliably; Weill and Ross (2004) found that top performers constrained local choice of infrastructure. The practitioner literature on total cost of ownership rests on the same economics: each distinct platform carries fixed costs in licences, skills, tooling, integration and security that are largely independent of how much of the enterprise it serves, so that cost per unit of service falls as platforms are consolidated. We take all of this as given. The model of Section 3 includes a run cost that falls with consolidation, and the paper’s claim is about what should be set against it.
2.2 Correlated failure in other fields
Other fields learned long ago that concentration and fragility travel together. In finance, Markowitz (1952) showed that the risk of a portfolio depends not on the risk of its holdings but on how they move together, and that diversification across imperfectly correlated assets lowers risk at no cost in expected return; the insight is the foundation of the field. In ecology, May (1972) showed that larger and more connected systems are, other things equal, less stable, and Tilman, Reich and Knops (2006) demonstrated experimentally that diverse ecosystems are more stable in their productivity than monocultures. Haldane and May (2011) carried the ecological argument into banking, showing that a system of institutions holding similar assets and connected by similar exposures is prone to the simultaneous failure that 2008 exhibited. In supply-chain management, Sheffi (2005) documented how redundancy and flexibility, not efficiency alone, decide which firms survive a disruption, and the resilience-engineering literature (Hollnagel, Woods & Leveson, 2006) has made the same argument for sociotechnical systems in general. In safety engineering, Perrow (1984) argued that tightly coupled, interactively complex systems produce accidents that are normal rather than exceptional, and Leveson (2011) that safety is a property of the system’s structure rather than of its components. In security, Geer et al. (2003) argued that a software monoculture is a national vulnerability because one exploit reaches everyone.
Each of these literatures contains the present paper’s claim in a different vocabulary. What the enterprise-IT literature lacks is the step that finance took in 1952: a model in which the benefit of concentration and the cost of correlation appear in the same equation, so that the trade-off can be computed rather than asserted. Section 3 is an attempt at that step.
2.3 Concentration risk as a supervised quantity
The European Digital Operational Resilience Act (Regulation (EU) 2022/2554), applicable to financial entities from January 2025, requires institutions to identify and assess ICT concentration risk arising from dependence on third-party providers, and to report major ICT-related incidents to their supervisor, in the Netherlands the central bank. The second Network and Information Security Directive (Directive (EU) 2022/2555) extends incident reporting and risk-management duties to essential and important entities across critical sectors, through the Dutch implementing act. Both treat concentration as a risk to be measured and managed, and neither says how much concentration is too much. The model below is offered as one answer, and the incident data that the reporting duties will accumulate is, as Section 15 argues, the means by which it could be calibrated.
3. A minimal model
3.1 Setup
An enterprise has business functions, each of which must run on a platform. It chooses how many distinct platforms to run, , with ; is full standardisation and is one platform per function. For clarity we take the functions to be spread evenly, per platform; uneven spreads are treated in Section 7.
Running platforms costs money. Each distinct platform carries a cost per period that is independent of how many functions it serves: licences, the skills to operate it, its tooling, its integration with the rest, its security. The run cost is
where is the cost that does not depend on the number of platforms. This is the case for standardisation: falls by for every platform removed.
Platforms fail. In each period, each platform suffers a disabling outage with probability , independently of the others; when it does, every function on it is down for the outage’s reference duration. The loss from an outage depends on the share of the enterprise’s functions that are down together:
where is the loss if the whole enterprise is down and is the convexity of the loss. If the loss is proportional to the share down: losing half the enterprise costs half as much as losing all of it. If the loss is convex: losing all of it costs more than twice losing half. Section 5 argues that is the normal case and says where it is not.
3.2 Expected loss and the total
With platforms each carrying a share of the functions, the expected outage loss per period is
The expression contains the paper’s claim. When , for every : the expected loss does not depend on how many platforms there are, and only the run cost decides, so full standardisation is optimal. When , falls as rises: more platforms, each carrying less, mean less expected loss, because the convexity penalises the large outages that few platforms produce. Consolidation raises expected loss not because failures become more likely, is unchanged, but because each failure becomes larger, and large failures cost more than their size.
The enterprise minimises the total
Treating as continuous and setting the derivative to zero gives the optimum in closed form:
The optimal number of platforms rises with the outage probability , the loss scale and the convexity , and falls with the cost of a platform . When the expression is below one, full standardisation is optimal; the orthodox advice holds. When it is above one, an interior number of platforms minimises total cost, and the difference is what we call the monoculture premium: the amount by which full standardisation costs more than the optimum, per period, once outage loss is counted.
3.3 Two regimes
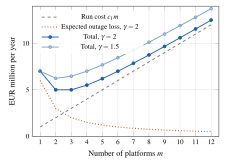
Equation (5) divides enterprises into two regimes, and the paper’s practical content lies in telling them apart. Table 1 shows both with illustrative parameters, and Figure 1 draws the second.
Table 1. Two regimes of the model, with illustrative parameters. Costs and losses in EUR million per year; omitted as it does not affect the optimum.
| Low-stakes | High-stakes | |
|---|---|---|
| Outage probability (per platform-year) | 0.02 | 0.10 |
| Loss if all down | 20 | 60 |
| Cost per platform | 1.0 | 1.0 |
| Convexity | 2 | 2 |
| 0.4 | 6.0 | |
| from (5) | 0.63 1 | 2.45 2–3 |
| : one platform | 1.4 | 7.0 |
| : two platforms | 2.2 | 5.0 |
| : three platforms | 3.1 | 5.0 |
| Monoculture premium | 0 | 2.0 |
In the low-stakes regime, outages are rare and cheap, is small relative to the cost of a platform, and is below one: standardise fully, as orthodoxy says. In the high-stakes regime, a disabling outage per platform-decade and a loss of EUR 60 million for a full outage, which is not exotic for a bank, an airline or a hospital group, is about two and a half, running one platform costs EUR 2 million a year more than running two or three, and the orthodox consolidation business case, which counts only , is wrong in sign.
3.4 Expectation is not the whole story
Equation (5) is about expected loss, and expected loss understates the case against monoculture. Consider the high-stakes regime with , where expected loss is EUR 6 million a year whatever is. With one platform, the enterprise loses nothing in nine years out of ten and EUR 60 million in the tenth. With three platforms, it loses EUR 20 million in about a quarter of years, EUR 40 million in about three years in a hundred, and EUR 60 million in one year in a thousand. The expectations are equal; the distributions are not. The one-platform enterprise has a one-in-ten chance each year of a loss that may exceed a regulatory reporting threshold, a capital buffer or a reputational tolerance; the three-platform enterprise has a one-in-a-thousand chance. A board that is not indifferent to the size of its worst year, which is every board, should prefer the three-platform distribution even where the expectations are equal, and the preference adds to the convexity argument rather than depending on it. Appendix A gives the tail figures.
4. Extensions of the model
The minimal model makes four simplifications that a practitioner will want relaxed before trusting its number: platforms fail independently, functions are spread evenly, an outage’s loss does not depend on its duration, and consolidation itself is free. Each can be relaxed without losing the closed form’s lesson, and each relaxation moves the optimum in a direction worth knowing.
4.1 Common shocks
Suppose that in addition to each platform’s independent failure, with probability per period a common shock disables every platform at once: a shared component fails, a cyber-incident spreads, a provider’s region goes down. The expected loss becomes
The common shock adds a floor, , that no number of platforms removes, and it scales down the benefit of diversification by . The optimum is as in equation (5) with replaced by : fewer platforms are worth running when common shocks dominate, because diversification cannot touch them. The practical reading is the one Section 7 develops: the first money should go to lowering , by removing shared components, and only then to raising , because a platform added under a shared component buys nothing against the shock that matters most.
4.2 Uneven spreads and the core-and-satellites design
Functions are rarely spread evenly. The common design is a core platform carrying most of the enterprise and satellites carrying the rest, and the question is whether the satellites are worth their cost. With shares summing to one, the expected loss is , which for a given is minimised by equal shares, because is convex; any unevenness raises expected loss above the even case. A core carrying nine tenths with two satellites at a twentieth each has, at , an expected loss of , barely below the single platform’s , while paying for three platforms. The satellites cost nearly as much as real diversification and deliver almost none of it. The design that pays is the one that splits the load, which is why the bank in Section 10 splits retail from business banking rather than carving a small satellite off a dominant core.
4.3 Duration
An outage’s loss grows with how long it lasts, and duration depends on the number of platforms in two opposing ways. Recovery capacity is finite, so a larger outage takes longer to recover if the same teams must restore everything serially; this is one of the sources of convexity in Section 5 and is already in . Against this, a landscape of more platforms has more distinct things that can break and more distinct recovery procedures to maintain, so that any one recovery may be slower for want of practice. The second effect argues for keeping modest and for drilling recovery on every platform kept, and it is one reason the rules of Section 12 prefer the smaller consolidation to the larger diversification.
4.4 The cost of consolidating
Consolidation is a migration, and migrations are themselves a source of outage: data moved, interfaces rebuilt, staff retrained, and a period of dual running in which the enterprise depends on both the old and the new. A consolidation business case should carry a one-off risk term, the expected loss from migration incidents, alongside the recurring saving, and should recognise that the term rises with the number of platforms removed. The model does not price it, because it is a one-off and the model is per period, but it moves the decision in the same direction as the premium: toward the smaller consolidation.
4.5 Sensitivity of the optimum
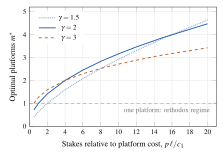
Figure 2 draws the optimum of equation (5) against the ratio , the stakes relative to the cost of a platform, for three values of . Below a ratio of about one the optimum is one platform whatever the convexity, and the orthodox advice is safe. Above it the optimum rises, slowly, with the stakes: a ratio of six, the bank’s case, gives two to three platforms; a ratio of twenty, a hospital group or an exchange, gives three to five. The curves are flat enough that the exact parameters matter less than the regime: an enterprise need only know roughly whether its ratio is below one or well above it to know whether it is in the orthodox or the premium regime, and the appendix gives the full grid.
5. Where the convexity comes from
The model’s result turns on : on the claim that losing the whole enterprise at once costs more than the sum of losing its parts separately. The claim should be argued, not assumed, and it should be said where it fails, because where it fails the orthodox advice is right.
5.1 Five sources of convexity
Mutual cover. When one function is down, others cover for it: a branch takes a call the app cannot, a warehouse ships what the portal cannot sell, staff work from paper. Cover is possible only if the covering function is up. A partial outage is absorbed by cover; a total outage has nobody to cover. The loss from the last function down is therefore larger than the loss from the first, which is convexity.
Finite workaround capacity. An enterprise has a finite number of people who can run manual workarounds, a finite number of telephone lines and a finite tolerance in its customers. A small outage fits within that capacity; a large one exceeds it, and the excess is lost outright.
Thresholds. Regulatory reporting, contractual service credits, reputational attention and media coverage all have thresholds. An outage below the threshold costs its direct loss; one above it costs its direct loss plus the threshold’s consequences. Thresholds make the loss function step upward with size, which is convexity in the aggregate.
Recovery parallelism. Recovery is done by teams with finite capacity. Two independent outages on different platforms can be recovered in parallel by different teams; one outage across everything is recovered serially by the same people, so its duration, and its loss, grows with its size.
Dependency contagion. Functions depend on one another. A function that is up but depends on one that is down is degraded; as the share down rises, the share degraded rises faster, because each additional outage removes a dependency for several survivors.
Each source is familiar to anyone who has managed an incident, and together they make the normal case for an enterprise of loosely coupled functions. The value of is an empirical matter; we use 1.5 and 2 as illustrations, and Section 15 says how it could be measured.
5.2 Where convexity is absent: tight coupling
The argument reverses where functions are so tightly coupled that losing any one of them is as bad as losing all. A payments chain in which authorisation, clearing and settlement must all work for any payment to complete is such a case: an outage of one step stops the chain, and the loss from one step down is the loss from the chain down. Within such a chain , diversification across platforms buys nothing, because any platform failing stops everything, and standardisation is correct: one platform, one failure mode, one recovery. Perrow’s (1984) tight coupling is the condition, and it gives the paper its first rule: standardise within tightly coupled chains, diversify across loosely coupled functions. The unit of diversification is not the function but the chain, and an enterprise should map its chains before it counts its platforms.
The same logic answers an objection. Running several platforms does not help if a failure on one propagates to the others; propagation is coupling, and coupled platforms are one platform for the purpose of the model. Diversity counts only where the platforms fail independently, which is the subject of the next section.
6. Measuring the convexity
Everything in the model turns on , and is a quantity no enterprise records. It can be measured, and this section shows how with a constructed example, so that a risk function can do the same with its own incident register.
6.1 The data
For each outage in the register, two numbers are needed: the share of the enterprise’s functions it reached, , and the loss it caused, , in the same units as . The share is usually recoverable from the incident record, which names the systems affected; the loss is harder, because enterprises record the direct cost of an incident and rarely its lost business, compensation or reputational consequence, and the convexity lives largely in those. A register that records only direct cost will understate . The measurement therefore begins with a one-off exercise: for the ten or twenty largest outages in the register, reconstruct the full loss with the business, including what was recovered by cover and workaround and what was not.
6.2 The fit
With the loss function , taking logarithms gives , a straight line whose slope is . Table 2 gives a constructed register of eight outages for an enterprise with twelve functions, and the fit. The outages that reached one function cost about a twentieth of the full-outage figure, not a twelfth; those that reached half the enterprise cost about a third, not a half; the slope is about 1.8. The number is illustrative, but its size is the point: an enterprise whose small outages are absorbed by cover and whose large ones are not will find well above one, and the fit makes the finding a number rather than an impression.
Table 2. A constructed incident register for an enterprise of twelve functions, and the convexity fitted to it. Loss in EUR million, reconstructed to include lost business and compensation. The fitted slope of on is ; the intercept gives .
| Outage | Functions | Share | Loss | |
|---|---|---|---|---|
| A | 1 | 0.08 | 0.7 | 0.012 |
| B | 1 | 0.08 | 1.1 | 0.019 |
| C | 2 | 0.17 | 2.4 | 0.041 |
| D | 3 | 0.25 | 4.9 | 0.084 |
| E | 4 | 0.33 | 8.0 | 0.138 |
| F | 6 | 0.50 | 17.0 | 0.293 |
| G | 9 | 0.75 | 36.0 | 0.621 |
| H | 12 | 1.00 | 58.0 | 1.000 |
6.3 Reading the residuals
The fit’s residuals are as informative as its slope. Outages that cost more than the line predicts for their size are the ones where cover failed, workarounds were exhausted or a threshold was crossed; their records say which, and the saying identifies the sources of Section 5 that are active in this enterprise. Outages that cost less than predicted are the ones where cover worked, and they identify the manual and mutual capabilities of Section 7 that are worth keeping. An enterprise that fits the line and reads the residuals learns both its and the reasons for it, which is more than the model asks and exactly what the consolidation decision needs.
6.4 Eliciting without data
Where the register is thin, can be bounded by elicitation. Ask the business, for a small outage and a large one, how long cover holds and what fraction of value it sustains; ask where the reporting, contractual and reputational thresholds lie and what crossing each costs; ask how recovery scales with the number of systems down. Each answer gives a point on the loss curve, and three or four points give a slope. The elicitation is coarse, but it is coarse in the right place: the decision between one platform and two turns on whether is near one or near two, and an elicitation can usually tell those apart.
7. Hidden monocultures
7.1 Nominal and effective diversity
The model counts platforms that fail independently. An enterprise that runs three application platforms on one operating system, authenticates all three through one identity provider, patches all three through one agent and hosts all three in one cloud region has three platforms for the purposes of its licence bill and one for the purposes of a failure in any of those shared components. Its nominal diversity is three; its effective diversity, against a shared-component failure, is one. The July 2024 outage was precisely this: organisations with diverse application landscapes discovered that they shared a single security agent, and the agent was the platform that failed.
Two measures make the distinction operational. For uneven spreads, where platform carries a share of the functions, the effective number of platforms is the inverse of the sum of squared shares,
the inverse Simpson index (Simpson, 1949), known in economics as the inverse Herfindahl index (Hirschman, 1964). Three platforms carrying half, three tenths and a fifth of the enterprise have , not three; one carrying nine tenths with two small others has . The enterprise’s expected loss is governed by , and equation (5) should be read as a target for it.
For shared components, where the platforms’ failures are correlated with pairwise correlation , the effective number is
which falls from at to one at . Three platforms with a correlation of one half are effectively one and a half; with a correlation of nine tenths they are effectively one. A shared component on which all platforms depend sets for failures of that component, however diverse the platforms are otherwise.
7.2 An inventory of shared components
Table 3 lists the components through which enterprises most often share a failure mode without noticing, because none of them appears as a platform in the application inventory. The common property is that each is chosen once, for the whole enterprise, by a function that does not count platforms: security chooses the agent, infrastructure chooses the hypervisor and the region, identity chooses the provider, networking chooses the DNS. Each choice is locally sensible and each adds a dependency with .
Table 3. Components through which nominally diverse platforms share a failure mode, and the function that typically chooses them without counting platforms.
| Shared component | Chosen by, and why it is invisible |
|---|---|
| Endpoint security agent | Security; deployed to every device by policy |
| Operating system and patch channel | Infrastructure; “the standard build” |
| Identity provider, single sign-on | Identity; every application authenticates through it |
| Hypervisor, cloud provider, region | Infrastructure; the hosting decision |
| DNS, certificates, content delivery | Networking; nobody else sees them |
| Integration bus, API gateway | Architecture; every integration passes through |
| A single SaaS vendor for several products | Procurement; one contract, one vendor manager |
| A single integrator or managed-service provider | Sourcing; one throat to choke |
| Network core, firewalls | Networking; one architecture |
The inventory gives the paper’s second rule: count effective diversity, not nominal diversity. A consolidation business case should state before and after, computed over the shared components as well as the application platforms, and a diversification decision should check that the platforms being kept separate do not share a component that makes them one.
7.3 Diversity of last resort
One platform is always available and almost never counted: the manual process. A branch that can take a payment on paper, a warehouse that can pick from a printed list, a ward that can chart by hand, is a second platform with a high run cost per transaction, a near-zero correlation with anything digital, and a capacity that is finite and decays if unexercised. In the model it is a platform with large and , which is to say the most expensive and the most valuable kind. Enterprises that have consolidated to one digital platform and allowed the manual capability to lapse have in the strictest sense, and the organisations that fared best in July 2024 were, by most accounts, those that could still work without their screens.
8. Diversity that costs little
Running a second platform is the expensive way to buy diversity, and the model prices it at . Several designs buy some of the same protection for much less, and the model shows why they work: each lowers the share that a single failure can reach, or lowers the correlation between the things that can fail, without adding a platform.
8.1 Diversity in time: rings and canaries
A change rolled out to every instance at once reaches if it is bad. The same change rolled out in rings, each ring held until the previous one has run clean for a period, reaches at most before it is stopped, so the loss from a bad change falls from to : with four rings and , to a sixteenth. Ringed rollout is diversity in time rather than in platform, it costs delay rather than money, and it is available for every shared component in Table 3. It is also what the vendor at the centre of the July 2024 outage adopted afterwards for the content updates that caused it (CrowdStrike, 2024): the first ring is the canary, and the canary is the cheapest platform an enterprise can run. The model’s caveat is that rings protect only against failures that announce themselves within the hold period; a defect that lies dormant reaches every ring, and dormant defects are a common shock.
8.2 Diversity in place: regions and sites
Hosting the same platform in two regions or two sites does not add a platform, but it lowers for the failures that are local to a region: power, network, a provider’s regional incident. It does nothing for failures in the platform’s own software, which reach both regions, and an enterprise that counts a second region as a second platform has confused the two. The model’s reading is that regional diversity lowers for one class of common shock and should be priced as such, not as .
8.3 Degraded modes
A platform that can fall back to a reduced mode, read-only, cached, queue-and-forward, when a dependency fails converts a total outage into a partial one: the share that an outage reaches becomes the share of function the degraded mode cannot sustain. Degraded modes are cheap where they are designed in and impossible where they are not, and the model counts them by lowering for the dependency’s failure. The manual process of Section 7 is the limiting case, the degraded mode that needs no software.
8.4 Diversity in suppliers, not products
Two products from one supplier share the supplier’s failure modes: its update process, its identity service, its financial health. An enterprise that wants supplier diversity in a layer where a second product is too expensive can sometimes obtain it in the layer’s dependencies instead, a second identity provider as fallback, a second DNS, a second certificate authority, at a fraction of a platform’s cost. These lower for the dependency’s failure and leave the platform count unchanged.
8.5 What these have in common
Each of these designs is cheap because it does not add a thing to run; it changes how an existing thing fails. The model is indifferent between a lower , a lower and a higher , because all three lower the expected loss, and an enterprise should buy them in order of cost per unit of reduction. Rings and degraded modes usually come first, regional and dependency diversity next, and a second platform last, which is the reverse of the order in which consolidation reviews consider them.
9. The Dutch situation
9.1 One morning in July
The outage of 19 July 2024 reached the Netherlands as it reached everywhere. Flights at the national airport were delayed and cancelled as airline and ground systems failed; hospitals reported disruption to systems on affected workstations and postponed care; government and private services were interrupted. The affected organisations had not chosen the same application platforms; they had chosen the same security agent, which ran at a privileged level on every Windows computer they owned. In the model’s terms, their application diversity was irrelevant: the agent was a shared component with , the outage reached a share close to one in every affected organisation, and the convexity did the rest. The cost was borne by organisations that had, individually, done nothing imprudent, which is the signature of a monoculture.
9.2 A single point of failure by design
The national digital identity, DigiD, operated by the government’s digital-services agency, is the means by which most residents reach the tax authority, municipalities, health insurers, pension administrators and hospitals online. It is a single point of failure by design, chosen for the consistency and convenience that one identity brings, and the choice is defensible on exactly the standardisation economics this paper takes as given. The model says what the choice costs: for every service that depends on it, the identity layer is a shared component with , and an outage, of which denial-of-service attacks have caused several, removes access to all of them at once. The mitigations that exist, a separate identity scheme for businesses, the forthcoming European digital-identity wallet, and the services’ own fallback channels, are diversification in the model’s sense, and their value can be stated in its terms: each lowers for some share of the dependent services. We do not argue that the national identity should be duplicated; we argue that the enterprises depending on it should count it in and keep a fallback channel exercised.
9.3 Regulation that counts concentration
DORA requires Dutch financial entities to assess their ICT concentration risk and to report major incidents to the central bank; the Dutch implementation of NIS2 extends reporting and risk-management duties to the critical sectors. Both make concentration a quantity that must be known. The model offers the supervisor and the supervised the same vocabulary: is the concentration, equation (5) is the level at which it stops being prudent, and the monoculture premium is the cost of exceeding it. The incident reports that both regulations now require are, as Section 15 argues, the data from which , and above all could at last be measured rather than assumed.
9.4 The hospitals’ morning
Hospitals are the sector in which the convexity of Section 5 is most visible, because the thresholds are clinical. A ward that loses its electronic record falls back to paper and manages; a hospital that loses every ward’s record at once, together with the laboratory, the pharmacy and the imaging systems that depend on the same workstations, cannot manage, and postpones care. Several Dutch hospitals reported exactly this on 19 July 2024, and the ones that recovered fastest were, by their own accounts, those with exercised paper procedures, which is the diversity of last resort in the model’s terms. The sector’s consolidation onto a small number of electronic-record platforms, defensible on every standardisation ground, is also a monoculture across hospitals: a defect in one platform reaches every hospital running it, which is a common shock at sector level that no single hospital’s diversification can address, and which the NIS2 implementing act, by naming the sector essential, now obliges the sector to consider.
9.5 What the regulations ask for, in the model’s terms
DORA’s requirements translate directly into the model’s quantities. The register of ICT third-party arrangements that it requires each financial entity to maintain is the shared-component inventory of Table 3 in regulatory form, and can be computed from it. The concentration-risk assessment it requires is the question of whether is prudent, to which equation (5) is one answer. And its major-incident classification, which uses thresholds of clients affected, duration, geographic spread and economic impact, is a source of convexity in its own right: an outage that crosses the thresholds carries reporting, supervisory and reputational consequences that one below them does not, so that the regulation itself steepens the loss curve above the threshold. An institution estimating its should include the regulation’s thresholds among the sources, which means that DORA both measures concentration and raises its cost.
9.6 The sovereignty question
The Dutch public debate about dependence on a small number of non-European cloud providers is, in the model’s terms, a debate about : a common shock, legal, political or commercial, that would reach every workload hosted with one provider at once. The model does not resolve the debate, which turns on the probability of such a shock, but it does state its terms: a second provider is a platform at cost that lowers for one class of shock, and whether it is worth running depends on , and in the usual way. Enterprises on both sides of the debate would argue more usefully with those three numbers than without them.
10. A constructed case
The case is constructed, not observed. It is not a report on any bank and its figures are illustrative; it exists to run the model on a decision of the kind that consolidation reviews produce.
10.1 The proposal
Bank K is a mid-sized Dutch bank that, after two mergers, runs four core-banking platforms, one per former entity, each carrying roughly a quarter of its functions. A cost review proposes consolidation to one, saving EUR 3 million a year in licences, skills, tooling and integration: the removal of three platforms at EUR 1 million each. The business case counts the saving and the migration cost and nothing else, and it is approved in principle.
10.2 The model’s reading
The bank’s risk function estimates, from its own incident history and from peers’, that a disabling outage of a core platform occurs about once a decade per platform, ; that a full outage of the reference duration would cost about EUR 60 million in compensation, lost business, regulatory consequence and reputation; and, from the shape of its past partial outages, which cost far less than their proportional share, that . These are the high-stakes parameters of Table 1, and the model’s reading of the proposal is in Table 4.
Table 4. Bank K: run cost, expected outage loss and total for the current estate, the proposal, and the model’s optimum. EUR million per year; omitted. Tail figures from Appendix A.
| 4 (now) | 1 (plan) | 2 | 3 | |
|---|---|---|---|---|
| Run cost | 4.0 | 1.0 | 2.0 | 3.0 |
| Expected loss | 1.5 | 6.0 | 3.0 | 2.0 |
| Total | 5.5 | 7.0 | 5.0 | 5.0 |
| Worst year in 20 (VaR 95%) | 30 | 60 | 30 | 20 |
The proposal saves EUR 3 million in run cost and adds EUR 4.5 million in expected outage loss. Its total is EUR 1.5 million a year worse than the estate it replaces, and its worst year in twenty doubles from about EUR 30 million to EUR 60 million. Consolidating to two platforms, by contrast, saves EUR 2 million in run cost, adds EUR 1.5 million in expected loss, and lowers the total by half a million with the worst year unchanged; consolidating to three lowers the total by the same amount and halves the worst year. The orthodox move is wrong in sign; the right move is a smaller consolidation than the review proposed.
10.3 The design
The bank consolidates to two platforms and applies the paper’s rules to the split. It maps its tightly coupled chains first: the payments chain, authorisation through settlement, is placed whole on one platform, because within it and diversity would buy nothing. The remaining functions are split along the loosest coupling the bank has, retail banking on one platform and business banking on the other, so that an outage of either leaves the other serving its customers and able to cover, which is where the convexity comes from. The bank then checks effective diversity: the two platforms are given different patch channels and different endpoint agents, are hosted in different cloud regions, and are authenticated through an identity layer whose fallback is exercised quarterly, so that the shared-component correlation is low rather than one. The manual capability for the retail branch network is kept and drilled. The bank’s is two; its , computed over shared components, is close to two; and its consolidation business case now carries a line for outage loss that the review’s did not.
11. A second constructed case: a hospital group
The bank’s case is about platforms. The second is about shared components, where the model says the larger risk usually lies. It is constructed, not observed, and is not a report on any hospital.
11.1 The estate
Hospital group G runs three hospitals on one electronic patient record, one laboratory system, one imaging system and one pharmacy system: four platforms, each a sector standard, each chosen well. Every workstation in the three hospitals runs the same operating system build, the same endpoint-security agent and the same patch channel; every clinician authenticates through one identity provider; all four platforms are hosted in one data centre with a warm standby in a second. Nominally . The group’s register, built for the NIS2 implementing act, shows that all four platforms depend on the workstation build, the agent, the identity provider and the data centre’s network, and that the standby shares the agent and the identity provider with the primary.
11.2 Effective diversity
For failures of the platforms’ own software, is about four, and the group is well diversified: a defect in the pharmacy system leaves the record, the laboratory and imaging running, and the clinical loss is bounded. For failures of the workstation build, the agent, the identity provider or the network, across all four platforms and : a defect in any of them reaches every clinician in every hospital at once, and the standby, which shares two of them, does not help. The group’s real diversity is one platform for the failure modes that history says are most likely to be correlated, and July 2024 was a failure of exactly that kind.
11.3 The numbers
The group’s risk function estimates a disabling failure of a shared component at per year across the set, a full-outage loss of about EUR 40 million for the reference duration, in postponed care, diversion, overtime and regulatory consequence, and, from the hospitals’ own partial outages, a of about 2.2, steep because a partial outage is absorbed by paper and a total one is not. For the shared-component failure mode, with at about EUR 0.8 million gives a ratio of four, and equation (5) gives : the group should run its shared components in two independent sets, not one.
11.4 The design
Running two electronic patient records would be ruinous, and the model does not ask for it; it asks for two independent sets of the shared components that currently make the four platforms one. The group splits its workstations into two builds with two agents from different vendors and two patch channels, assigns each hospital department to one build so that every ward has colleagues on the other, adds a second identity path as a fallback that is exercised monthly, and moves the standby data centre to a network and agent that the primary does not share. The platforms stay at four. The effective diversity for shared-component failures rises from one to about two, which is what the model asked for, at a cost well under a second platform’s: the second build and agent cost a fraction of , the second identity path is a dependency rather than a platform, and the ringed rollout of Section 8 is applied to both builds so that a bad update reaches a quarter of the estate at most. The paper fallback is kept, funded and drilled quarterly, because for the group it is the only platform with a correlation of zero to everything else.
11.5 What the case shows
The bank’s case showed that the orthodox consolidation can be wrong in sign. The hospital’s shows something more common: an enterprise that is diversified in its platforms and a monoculture in its components, where the premium is being paid without a consolidation ever having been proposed, and where the remedy costs little because it is diversity in components, time and dependencies rather than in platforms. Most enterprises are closer to the hospital than to the bank, and the register that DORA and NIS2 now require is the instrument that shows them so.
12. Rules
Standardise within chains, diversify across functions. Map the tightly coupled process chains; within each, one platform. Across loosely coupled functions, the model’s optimum applies. The unit of diversification is the chain.
Count effective diversity. Compute over shared components as well as application platforms, before and after any consolidation. Three platforms on one agent are one platform.
Price the premium. Add to every consolidation business case a line for expected outage loss, before and after, using the enterprise’s own estimates. A case that cannot state , and is not a case about risk, and consolidation is a decision about risk.
Check the tail. State the worst year in twenty before and after, and compare it with the enterprise’s reporting thresholds, capital buffers and contractual exposures. Equal expectations with different tails are different decisions.
Keep the diversity of last resort. Treat the manual capability as a platform: fund it, drill it, and count it. It is the only platform with a correlation of zero.
Prefer the smaller consolidation. Where the model gives an interior optimum, the loss from stopping one platform short of it is small and the loss from going one platform past it is large, because the expected-loss curve is steep near one. When in doubt, keep a platform.
13. Pricing the premium in a business case
The rules of Section 12 ask that the premium be priced. This section shows what the line looks like in the document where consolidation is actually decided, because a risk that is not on the business case’s page is not in the decision. Table 5 sets out a consolidation case in the form most finance functions use, with the lines the model adds marked, for the bank of Section 10.
Table 5. A consolidation business case for Bank K with the model’s lines added (marked ). Annual figures in EUR million except the one-off migration lines. The orthodox case shows the proposal saving 3.0 a year; the full case shows it costing 1.5 a year more than today and 2.0 more than the two-platform alternative, with a doubled worst year.
| Line | Today () | Proposal () | Alternative () | Source |
|---|---|---|---|---|
| Run cost of platforms, | 4.0 | 1.0 | 2.0 | Licences, skills, tooling, integration |
| Run cost, other () | 12.0 | 12.0 | 12.0 | Unchanged by |
| Orthodox annual total | 16.0 | 13.0 | 14.0 | |
| Expected outage loss, | 1.5 | 6.0 | 3.0 | , , |
| Of which attributable to shared components () | 0.6 | 0.6 | 0.6 | ; unchanged unless components are diversified |
| Full annual total | 17.5 | 19.0 | 17.0 | |
| Worst year in twenty (VaR 95%) | 30 | 60 | 30 | Appendix A |
| Crosses DORA major-incident thresholds in worst year | likely | certain | likely | Clients affected, duration |
| One-off migration cost | – | 18.0 | 9.0 | Programme estimate |
| One-off migration outage risk | – | 2.4 | 1.0 | Expected loss from migration incidents |
| Effective diversity after shared components | 3.6 | 1.0 | 1.9 | From the register |
Three features of the full case are worth drawing out. First, the orthodox case and the full case disagree not about the size of the saving but about its sign: the proposal’s run-cost saving of EUR 3 million is real, and it is smaller than the EUR 4.5 million of outage loss it adds. A finance function that sees only the top block approves the proposal; one that sees the whole page prefers the alternative, and both are reading the same numbers. Second, the shared-component line is unchanged across the columns, which is the model’s way of saying that the consolidation decision does not touch the enterprise’s largest correlated risk; that risk is addressed by the design of Section 8, not by the platform count, and a case that shows the line unchanged invites the question of what would change it. Third, the tail lines are not additive with the rest and should not be netted against the saving; they are shown so that the board can see what it is accepting, and they are the lines that a supervisor reading the case under DORA will ask about first.
The template generalises. Any consolidation case can carry the four starred annual lines, the two starred one-off lines and the effective-diversity line, and an enterprise that cannot fill them has not yet estimated , and , which Appendix B shows how to do. The exercise usually takes a risk function a few weeks, which is short against the years a consolidation takes and the decade over which its premium is paid.
14. Implications for supervisors
The regulations that now require Dutch enterprises to assess concentration risk do not say how much concentration is too much, and a supervisor assessing an institution’s assessment needs a standard. The model offers three questions that a supervisor can ask of any institution’s consolidation decision or concentration assessment, each of which has a number as its answer.
The first is the effective diversity of the estate, computed from the register over shared components as well as platforms, and whether it has been computed at all. An institution that reports its platform count without its shared components has reported nominal diversity, and July 2024 is the standing demonstration that nominal diversity is not the quantity that fails. The second is the institution’s own estimate of its loss convexity, with the incident data or elicitation that supports it, because an institution that has not estimated cannot have priced its concentration and an institution whose is near one has, by its own account, little to gain from diversifying and should be able to say why. The third is whether the consolidation decisions of the last several years carried the lines of Table 5, and if they did not, what the premium on each would have been. None of these questions requires the supervisor to prescribe a number of platforms, which the model does not do either; they require the institution to show that it knows the trade-off it has made, which is what a concentration-risk assessment is for.
A supervisor can also use the model at sector level, where its common-shock form applies. A sector in which most institutions run the same platform, the same agent or the same provider has a that no institution’s own diversification lowers, and the sector’s resilience is then a property of the supplier rather than of the supervised. The model gives the supervisor the vocabulary to say so, and the register data gives it the means to see it before the morning on which it is demonstrated.
15. Limitations and research agenda
This is theoretical research. Four limitations follow, each with a test.
First, is unmeasured. It is the model’s decisive parameter and the one that no enterprise currently records. It could be estimated from incident histories by regressing the loss of each outage on the share of the enterprise it reached, within an enterprise or across a sector; the incident reporting that DORA and NIS2 now require will, for the first time, produce the sample. We predict that is above one for most enterprises and sectors, well above one where thresholds are prominent, and at or below one within tightly coupled chains. A finding of across the board would refute the paper’s practical claim and leave only its tail argument.
Second, the model takes platform failures as independent and treats correlation through . A fuller model would give the joint distribution of failures across a dependency graph, and the shared-component inventory of Section 7 is the first step toward one. The test is whether computed from an inventory predicts the correlation of outages observed.
Third, the run cost is linear in platforms and the loss is a power of the share down. Both are simplifications; fixed costs per platform may fall with scale and losses may step rather than curve. The qualitative result, an interior optimum whenever loss is convex and is large relative to , survives any cost function that rises with platforms and any loss function that is convex; the closed form does not.
Fourth, the case is constructed and the Dutch reading is interpretive. The events of July 2024 and the design of the national identity are public; the claim that enterprises depending on them should count them in is ours. A field study that computed for a sample of Dutch financial entities from their DORA concentration assessments, and compared it with equation (5) using their own loss estimates, would show how far the sector is from the model’s optimum and in which direction.
16. Conclusion
Standardising the IT landscape lowers its running cost and raises its fragility, and the two do not cancel. Fewer platforms mean larger outages, and when the harm of an outage grows faster than its size, which it does whenever functions can cover for one another, workarounds are finite and thresholds exist, expected outage loss rises as platforms are consolidated even though no failure becomes more likely. The number of platforms that minimises the sum of running cost and outage loss has a closed form: it rises with the probability and scale of outages and with the convexity of the loss, and falls with the cost of a platform. Below one, the orthodox advice holds; above one, the enterprise that standardises fully pays a monoculture premium that its consolidation business case does not show.
We at Nashua have argued that the premium is real, that it is largest where enterprises least expect it, in nominally diverse landscapes that share a component, and that it should be priced into every consolidation decision alongside the savings. The rules are few: standardise within tightly coupled chains and diversify across loosely coupled functions; count effective diversity, not nominal; price the premium; check the tail; and keep the manual capability as the one platform that fails with nothing else. The convexity on which the argument rests is the quantity most worth measuring, and the regulations that now make Dutch enterprises report their incidents will, for the first time, make it measurable. We would rather it were measured than believed.
Appendix A. Tail figures
For equally loaded platforms, each failing independently with probability per year and each carrying a share , the number of platforms down in a year is binomial with parameters and , and the loss is when are down. The figures below use and ; the 95% value at risk is the smallest loss whose exceedance probability is below 5%.
Table 6. None
| P(no outage) | 0.900 | 0.810 | 0.729 | 0.656 |
| P(one platform down) | 0.100 | 0.180 | 0.243 | 0.292 |
| P(two down) | – | 0.010 | 0.027 | 0.049 |
| P(three or more down) | – | – | 0.001 | 0.004 |
| Loss, one down () | 60 | 30 | 20 | 15 |
| Expected loss () | 6.0 | 6.0 | 6.0 | 6.0 |
| Expected loss () | 6.0 | 3.0 | 2.0 | 1.5 |
| VaR 95% () | 60 | 30 | 20 | 30 |
The value at risk is approximately 30 because the probability of two or more platforms failing in the same year, about 5.2%, is just above the 5% level; with slightly lower it would be 15. The point of the table is the first and last rows: expected loss under is identical across the columns, and the worst year in twenty is not.
Appendix B. Estimating the parameters
Outage probability . From the enterprise’s incident register: disabling outages per platform-year over the longest available window, pooled with peer or sector data where the enterprise’s own history is short. Count outages that disabled the platform for the reference duration or longer; shorter outages belong to a different loss scale.
Loss scale . The loss from the whole enterprise being down for the reference duration: lost revenue or service, compensation and service credits, regulatory consequence, recovery cost, and a reputational estimate. Most enterprises have this figure in their business-continuity planning under another name.
Convexity . From the incident register: for each outage, the share of functions reached and the loss incurred; fit . Where the register is thin, elicit from the sources of Section 5: ask how long cover and workarounds hold, where the thresholds lie, and how recovery scales, and bound from the answers.
Platform cost . From the consolidation business case itself: the saving claimed per platform removed is, by construction, .
Effective diversity . From the application inventory and the shared-component inventory of Table 3: compute the share-based measure over platforms, then for each shared component record which platforms depend on it and set their pairwise correlation to one for that component’s failure mode.
Appendix C. Sensitivity grid
Table 7 gives from equation (5) for a grid of the stakes ratio and the convexity . Values below one mean full standardisation.
Table 7. Optimal number of platforms by stakes ratio and convexity.
| 0.5 | 1 | 2 | 4 | 8 | 16 | |
|---|---|---|---|---|---|---|
| 0.19 | 0.33 | 0.57 | 1.00 | 1.74 | 3.03 | |
| 0.40 | 0.63 | 1.00 | 1.59 | 2.52 | 4.00 | |
| 0.71 | 1.00 | 1.41 | 2.00 | 2.83 | 4.00 | |
| 0.92 | 1.18 | 1.55 | 2.05 | 2.70 | 3.56 | |
| 1.00 | 1.26 | 1.59 | 2.00 | 2.52 | 3.17 |
Appendix D. Expected loss with correlated failures
Let the platforms fail with marginal probability each and pairwise correlation between failure indicators. The expected number of platforms down is regardless of , so with linear loss () correlation does not change the expectation; it changes only the distribution, concentrating the same expected loss into fewer, larger events. With convex loss, correlation raises the expectation, because it raises the probability of the large that convexity penalises. For the common-shock form of Section 4, in which a shock with probability disables all platforms and failures are otherwise independent, the expected loss is exactly, and the effective number of platforms that reproduces it in the independent model is for . The pairwise-correlation form of Section 7 is the corresponding reduction for the variance of the share down, and is the better measure when the correlation is diffuse rather than a single shock.
References
CrowdStrike (2024, 6 August). Channel File 291 incident: Root cause analysis. CrowdStrike Holdings. https://www.crowdstrike.com/wp-content/uploads/2024/08/Channel-File-291-Incident-Root-Cause-Analysis-08.06.2024.pdf
European Parliament and Council (2022). Regulation (EU) 2022/2554 on digital operational resilience for the financial sector (DORA). Official Journal of the European Union, L 333, 27 December 2022. https://eur-lex.europa.eu/eli/reg/2022/2554/oj
European Parliament and Council (2022). Directive (EU) 2022/2555 on measures for a high common level of cybersecurity across the Union (NIS 2). Official Journal of the European Union, L 333, 27 December 2022. https://eur-lex.europa.eu/eli/dir/2022/2555/oj
Geer, D., Bace, R., Gutmann, P., Metzger, P., Pfleeger, C. P., Quarterman, J. S., & Schneier, B. (2003, 24 September). CyberInsecurity: The cost of monopoly. Computer & Communications Industry Association. https://www.schneier.com/essays/archives/2003/09/cyberinsecurity_the.html
Haldane, A. G., & May, R. M. (2011). Systemic risk in banking ecosystems. Nature, 469, 351–355. https://doi.org/10.1038/nature09659
Hirschman, A. O. (1964). The paternity of an index. American Economic Review, 54(5), 761–762.
Hollnagel, E., Woods, D. D., & Leveson, N. (Eds.) (2006). Resilience engineering: Concepts and precepts. Ashgate. (Reissued by CRC Press, 2017. https://doi.org/10.1201/9781315605685)
Leveson, N. G. (2011). Engineering a safer world: Systems thinking applied to safety. MIT Press. https://doi.org/10.7551/mitpress/8179.001.0001
Markowitz, H. (1952). Portfolio selection. Journal of Finance, 7(1), 77–91. https://doi.org/10.1111/j.1540-6261.1952.tb01525.x
May, R. M. (1972). Will a large complex system be stable? Nature, 238, 413–414. https://doi.org/10.1038/238413a0
Perrow, C. (1984). Normal accidents: Living with high-risk technologies. Basic Books.
Ross, J. W., Weill, P., & Robertson, D. C. (2006). Enterprise architecture as strategy: Creating a foundation for business execution. Harvard Business School Press. ISBN 978-1-59139-839-4.
Sheffi, Y. (2005). The resilient enterprise: Overcoming vulnerability for competitive advantage. MIT Press.
Simpson, E. H. (1949). Measurement of diversity. Nature, 163, 688. https://doi.org/10.1038/163688a0
Tilman, D., Reich, P. B., & Knops, J. M. H. (2006). Biodiversity and ecosystem stability in a decade-long grassland experiment. Nature, 441, 629–632. https://doi.org/10.1038/nature04742
Weill, P., & Ross, J. W. (2004). IT governance: How top performers manage IT decision rights for superior results. Harvard Business School Press. ISBN 978-1-59139-253-8.
Weston, D. (2024, 20 July). Helping our customers through the CrowdStrike outage. The Official Microsoft Blog. https://blogs.microsoft.com/blog/2024/07/20/helping-our-customers-through-the-crowdstrike-outage/